
Discrepancies between recorded stock levels and actual inventory are common for B2B small and midsize businesses. They are not always the result of poor overall management, but often stem from gradual, hard-to-detect losses that accumulate over time and directly impact profitability and operational reliability.
This is where the inventory shrinkage rate becomes a critical metric. It helps measure inventory losses related to storage, logistics, and internal processes. In this article, we’ll clearly define inventory shrinkage, explain why it occurs, analyze its consequences, show how to calculate it, and most importantly, how to reduce it sustainably using best practices and the right tools.
Inventory shrinkage refers to the loss of goods recorded over a given period. It encompasses all losses that create a gap between theoretical inventory and actual inventory (the goods physically available for sale).
Theoretical inventory is calculated based on recorded stock movements such as supplier receipts, sales, returns, and transfers. Shrinkage occurs when this theoretical inventory no longer reflects physical reality. It includes negative discrepancies caused by missing, damaged, expired, or unsellable products, as well as data entry errors or theft.
In day-to-day operations, the inventory shrinkage rate is therefore a key performance indicator. It helps measure data accuracy, highlight operational weaknesses, and enables businesses to take action before losses become structural.
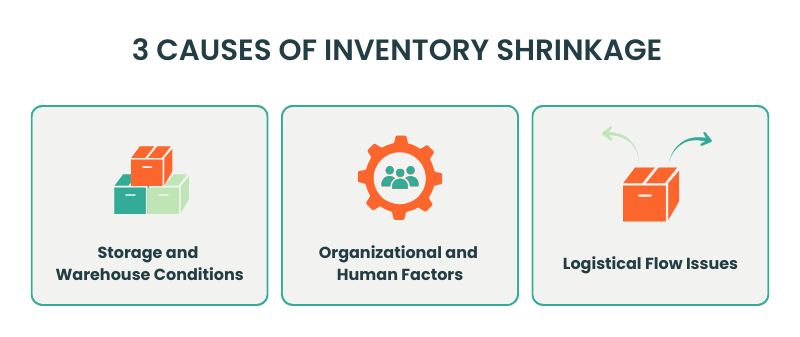
Inventory shrinkage is never random. It usually results from a combination of storage issues, internal organization, and logistical flows.
In warehouses, shrinkage often comes from breakage, damage, or inadequate storage conditions. Poor handling, improper stacking, or products stored for too long can become unsellable without being immediately removed from recorded inventory.
Organizational issues also play a major role. A data entry error during receiving or shipping, a missing transaction, or non-standardized processes can quickly create long-lasting discrepancies between physical and recorded stock.
Finally, logistical flows such as picking errors, poorly managed customer returns, or unrecorded internal transfers contribute to the accumulation of stock differences.
These situations are especially common in businesses that lack real-time inventory tracking tools.
A high inventory shrinkage rate directly affects margins. Every lost or damaged product represents an immediate financial loss that is not always clearly visible in accounting reports.
Cash flow is also impacted. Inventory that exists on paper but cannot be sold ties up capital and leads to unexpected stockouts. These imbalances complicate purchasing decisions and forecasting.
Inaccurate inventory data undermines trust across teams. Sales teams may sell products that are no longer available, damaging customer relationships and satisfaction. Over time, decisions based on unreliable data lead to broader operational disorganization.
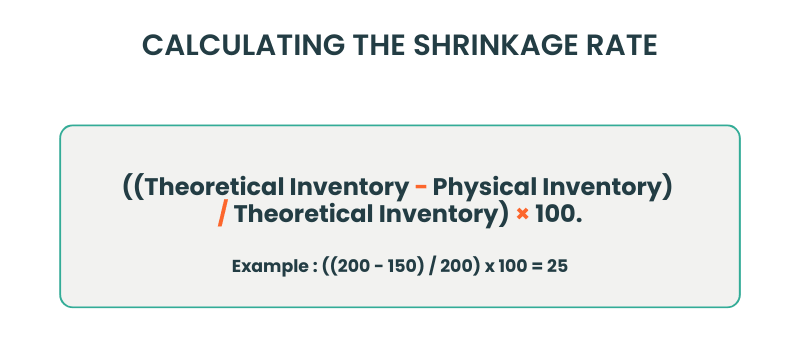
The inventory shrinkage rate is calculated by comparing theoretical inventory with physical inventory observed during a stock count. It measures the volume or value of losses over a given period relative to initial or average inventory.
Inventory Shrinkage Rate (%) = ((Theoretical Inventory − Physical Inventory) / Theoretical Inventory) × 100
A high result indicates significant unrecorded or unidentified losses. Ideally, businesses should aim for a rate as close to 0% as possible.
This calculation highlights the critical role of theoretical inventory. If stock movements are not accurately recorded, the shrinkage rate will not reflect reality. That’s why it’s essential to define a consistent analysis period and rely on reliable data.
A one-time calculation provides a snapshot. However, regular monitoring of inventory shrinkage trends is the only way to detect issues early and implement lasting corrective actions.
Reducing shrinkage starts with better organization of receiving, storage, and shipping processes. Every stock movement must be systematically recorded to ensure accurate theoretical inventory. Using SKU and barcodes significantly reduces data entry errors.
Strict monitoring of inventory flows is essential. Slow-moving products are more exposed to damage, obsolescence, and handling errors. Tracking the inventory turnover rate helps identify low-rotation items and reduce exposure to shrinkage.
Regular inventory counts are another key lever. They allow businesses to quickly reconcile theoretical and physical inventory. Cycle counts by location or product category are often more effective than a single annual inventory count.
Digitizing inventory management greatly improves traceability and real-time visibility. The right software reduces human error and helps identify loss sources much earlier.

The inventory shrinkage rate is a critical KPI for improving logistics performance. It must be based on reliable, continuously updated data.
Erplain is a B2B sales and inventory management software designed for small and midsize businesses. It centralizes sales, purchases, and inventory in a single platform. Every stock movement is automatically recorded, ensuring accurate theoretical inventory at all times.
Erplain helps businesses control inventory shrinkage through:
By relying on reliable data and centralized inventory management, Erplain helps SMBs sustainably reduce inventory shrinkage, optimize cash flow, and turn inventory management into a true performance driver.
Inventory shrinkage refers to any loss of goods observed between theoretical and physical inventory. It can result from damage, breakage, expired products, handling errors, or unrecorded stock movements. Unlike isolated losses, shrinkage is often gradual and accumulates over time.
The inventory shrinkage rate is a metric that measures the extent of inventory losses over a given period. Expressed as a percentage, it highlights the gap between recorded and actual inventory and helps assess inventory management reliability.
Inventory shrinkage is calculated by comparing theoretical inventory with physical inventory during a stock count using the formula:
(Theoretical Inventory − Physical Inventory) / Theoretical Inventory × 100.
It can be calculated in units or value, as long as the underlying data is accurate.
There is no universal “normal” shrinkage rate. It varies by industry, product type, and storage conditions. A low and stable shrinkage rate may be acceptable, but a consistently high or increasing rate usually indicates deeper process or tracking issues that need attention.